
U.S. public education has always been a hot topic, and even more so over the past decade. It is a field of constant change, debate, trends and new philosophies. You may have heard the phrase, "new paradigm of learning" or "21st century paradigm of teaching" being used in articles or workshops over the past couple years. What does this exactly mean? Is it really new?
There are variations on what one might say when it comes to defining this phrase. Upon researching different opinions, I like Terry Heick of Teach Thought’s version, 4 Goals of Paradigm Thinking, as a way to sum up what schools and educators should be focusing on with today’s learners. Mr. Heick’s version is:
As an educator in the K-8 realm, I reflected on what I personally would create as my statement for a “new paradigm of learning” in my own teaching and decided on the following:
I have become a big advocate of community outreach in my projects and lessons that I design for my classes, which is one I don't see enough on lists. I feel this area is underutilized and is important. This concept falls under 'global connection (awareness)' for me, as the term 'community interaction' did encompass enough of how I view the idea. Not only should students be engaging with their local community, but they should be engaging with the global community as well. This assists in supporting other crucial areas, such as problem-solving and empathy, two areas that are at the top of my list for students to actively engage in during class time. Student-interest is also a big one for me. In a survey, I will ask my students at the beginning of the year what they are interested in learning. Self-interest equals buy-in and self-motivation.
As to the question, “Is it really new?” To me, much of what is touted as new in education is not really new. There have been great educators out there doing all of these ideas long before such lists were being made. Ideas and philosophies in education tend to cycle, even if the cycle is a long one.
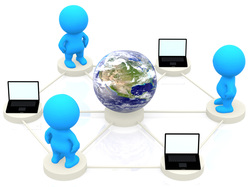
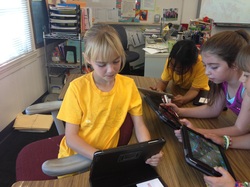
One major change in education has been in our ability to connect on a global scale and to learn more about our world today, due to technology. This ability has really opened doors to more creative endeavors and possibilities for the classroom teacher. However, the biggest change over the years is the accessibility of technology and the educational technology tools of today that allow for affordability and much easier integration into the classroom for the average teacher. So many educational tools...but that is a topic for another post.
What would your personal 'new paradigm of learning' be? I encourage you to reflect and create your own. No matter what level you teach, it can assist with guiding your overarching goals as an educator.
There are variations on what one might say when it comes to defining this phrase. Upon researching different opinions, I like Terry Heick of Teach Thought’s version, 4 Goals of Paradigm Thinking, as a way to sum up what schools and educators should be focusing on with today’s learners. Mr. Heick’s version is:
- Self-knowledge
- Meaningful Community Interaction
- Adaptive Critical Thinking
- New (Digital) Media Literacies
As an educator in the K-8 realm, I reflected on what I personally would create as my statement for a “new paradigm of learning” in my own teaching and decided on the following:
- Collaboration
- Process
- Student-Interest
- Global Connection (Awareness)
- Digital Literacy
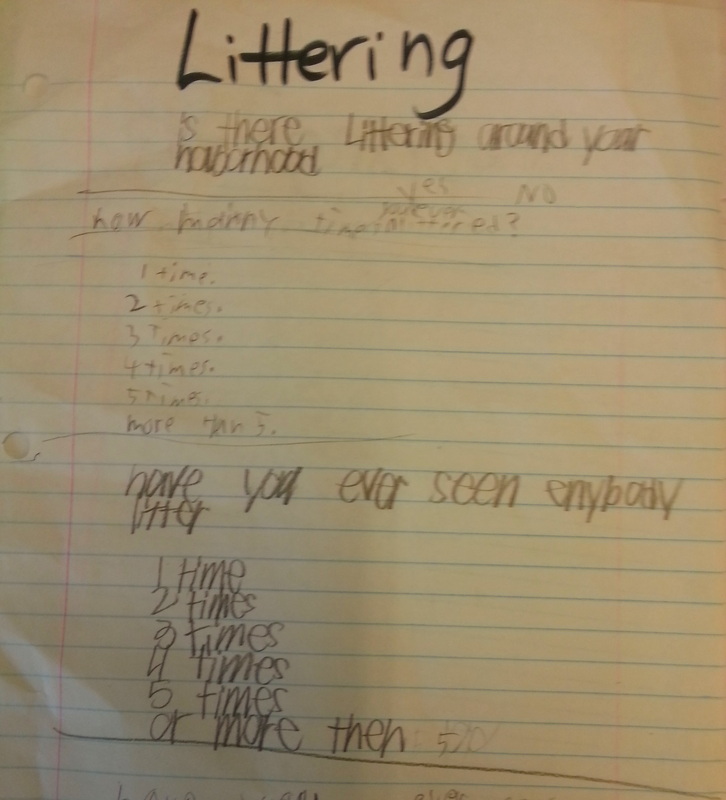
I have become a big advocate of community outreach in my projects and lessons that I design for my classes, which is one I don't see enough on lists. I feel this area is underutilized and is important. This concept falls under 'global connection (awareness)' for me, as the term 'community interaction' did encompass enough of how I view the idea. Not only should students be engaging with their local community, but they should be engaging with the global community as well. This assists in supporting other crucial areas, such as problem-solving and empathy, two areas that are at the top of my list for students to actively engage in during class time. Student-interest is also a big one for me. In a survey, I will ask my students at the beginning of the year what they are interested in learning. Self-interest equals buy-in and self-motivation.
As to the question, “Is it really new?” To me, much of what is touted as new in education is not really new. There have been great educators out there doing all of these ideas long before such lists were being made. Ideas and philosophies in education tend to cycle, even if the cycle is a long one.
One major change in education has been in our ability to connect on a global scale and to learn more about our world today, due to technology. This ability has really opened doors to more creative endeavors and possibilities for the classroom teacher. However, the biggest change over the years is the accessibility of technology and the educational technology tools of today that allow for affordability and much easier integration into the classroom for the average teacher. So many educational tools...but that is a topic for another post.
What would your personal 'new paradigm of learning' be? I encourage you to reflect and create your own. No matter what level you teach, it can assist with guiding your overarching goals as an educator.

 RSS Feed
